Quick Intro:
Click here to see the Latest News. You can Download the Runpaces Version 9.3 demo, with most of the features of the full version here, and contact me here: eburger@aol.com
The shareware demo is a free download; the price for the full, registered version
is $35. Most features are enabled in the shareware, but some of the more specialized
ones are reserved for the registered version. When you register, you send a
code given by the program, and I then send you the key to unlock the extra features.
I'm happy to supply two such keys, so that you can use it on two computers.
This shareware version, like its full, registered counterpart, is a Windows-based
program that provides a (unique, I believe) way of modeling an individual's
running race time versus distance relation, allowing predictions of race times
at various distances and comparison to a standard performance curve to help
evaluate relative strengths and weaknesses. For those who run 'on their own',
it's a great tool for finding which performances were really the 'best' and
for planning a realistic pace to run for a distance which is unfamiliar or at
least not run recently. For coaches, it provides an objective way to arrive
at realistic expectations and to guide the athlete towards the events for which
he/she is best suited.
Runpaces is much more than a simple formula or curve-fit. It uses a model based
on the physics and physiology and then sorts through your input data to pick
the most appropriate performances for constructing your personal performance
profile. Many other features, such as your "best distance", aerobic
and anaerobic threshold paces, equivalent performances at different distances,
and the effects of uneven pacing and hills, and the ability to store performances
in personal data files are included as well (though some of these only with
the registered version). The user interface forms are easy to use, and output
is both tabular and graphical. Printouts are available with the registered version.
I've been a runner and running enthusiast since about 1976 and began analyzing
my own pace versus distance data as early as 1977, as a senior running track
and cross country in high school. I never got that good at it (4:56 mile), but
I've been running ever since and keeping data on it most of that time. I got
my degrees in physics (which I really like) and started teaching it at the high
school level. By 1990 I was coaching track and cross country and soon decided
to try to attack the old pace versus distance problem from a physics and physiology
standpoint, using the computer. I did this mostly for fun and just the challenge
of it, but quickly began applying it both to myself and to those I coach, with
great results. Now I want to share it with others, though I am asking the $35
for the full version since this represents a LOT of work.
How it works
This a very brief description of how I came up with this program, leaving out a
multitude of details. Basically, in my early 30's, I'd been running for half my
life and was teaching physics and coaching cross country and track. A physics
problem (from the textbook) which I gave for homework got me thinking. It made the
claim that 'one model of running' assumed that the power output in running went into
accelerating the arms and legs, and was proportional to the square of the speed.
This got me excited about the possibility of modeling running performance, especially
the fall-off in speed with increasing distance, which I was so familiar with from
my own running and coaching. I initially accepted the square relationship and assumed
a steady aerobic power could be supplied, while accumulating a fixed limit of oxygen
debt, with these power and energy terms derivable from race performances at two
different distances. I knew that would be too simple (and it was, as neither starting
assumption turned out to be quite true), but it gave somewhat reasonable results
right off the bat, as a good starting point in this adventure. It then remained to do a
variety of mathematical adjustments to whip the curve into shape. I quickly got it working
so well that it became a valuable predictive tool in my coaching. Over the ensuing
27 years, I've continued to tweak the model and add feature after feature, using
as much basic physics and physiology as I can, but then doing LOTS of research, analysis, and
curve fitting, to produce what I truly think is the most accurate and versatile running
model you'll find anywhere.
Comparison to other models
When I started on this project, I had seen very little in the way of others'
attempts to do the same sort of thing. As I've begun showing the program to
others and also as I've gotten access to the Internet, I've finally seen some
of these efforts. Some are in the form of published tables while some others
are in the form of computer programs (some free).
So what makes this program different? For one thing, most (though not quite
all) of the others base performance on a single result. While this has the advantage
of requiring little in the way of input, it does not at all address the problem
(discussed above) of the different makeup (i.e. speed/endurance) of different
runners. Usually the models or charts seem geared heavily towards runners specializing
in the longer distances (5 or 10 K and up) and are quite far off when applied
to, say, an 800 meter specialist who wants to try the 1500. In addition, some
of these charts are really accurate only for elite runners, with fairly inaccurate
results for more modest achievers. One attempt to address this can be found
in Martin and Coe's book (referenced below). This consists of three sets of
formulas - for 10K, 5K, and 1500 m specialists. Other than an obvious typo and
some very minor discrepancies, I found these to fit my program's output very
closely if I used two points for each formula. Coming from such an authoritative
source, this may be seen mostly as a nice validation of my program, but still,
it's three separate formulas and one may not know offhand which to use. There
are also no provisions for race distances other than the 5 or 6 listed or for
runners with other specialties. In short, it's useful but incomplete.
Another approach I have seen really has a different purpose in mind. A number
of 'equivalent performance' schemes have been devised (a good example being
Gardner and Purdy's reference below). These can work very nicely, but only over
a rather limited range surrounding the runner's optimum event. For example,
a miler who rates 700 'Purdy points' in that event probably rates quite close
to that in the 2 mile and the half mile, but outside this the fit starts to
stray significantly. The authors acknowledge this problem and, again, the issue
of comparing performances at different distances in GENERAL is quite separate
from that of comparing an INDIVIDUAL'S performances at different distances.
To address some specific models, one type I've run across is the power-law fit.
An example of this is found on Runner's World's web page. When testing against
data I've collected, I find this one to be fairly good only under certain circumstances.
First of all, it assumes that an individual's race times are proportional to
a certain power (1.07) of the race distance. This gives a rather small drop-off
in speed with increasing distance, mainly appropriate for runners specializing
in distances of at least 10K and running relatively high mileage. The other
problem is that even in general (allowing different power laws for differnt
runners), the fit is not the best. Specifically, I believe it gives over-optimistic
interpolations and pessimistic extrapolations. Again, RUNPACES uses a model
that has a sound physical/physiological basis and therefore fits real data much
better than most arbitrary (even if inspired) choices of function are likely
to, though even this model contains 'free parameters' that have allowed me to
'bend' the curve to make it even more accurate.
At this point, I need to point out that some of these other approaches DO have
a place . . . in this program! For example, a generalized performance curve
like Gardner and Purdy's allows a type of objective rating system and, when
used in combination with an individual's performance curve, allows one to see
which event that individual is 'best at'. I had developed such a performance
curve based on world records, both for males and for females. I also adapted
this curve to fit U.S. records, state high school records, or any other level.
I found later that these curves almost exactly fit equal-Purdy-point curves,
though suspect the mathematical form may be fairly different.
As a first attempt to use such curves to rate performances, I simply had the
program divide the individual's speed for a race by the generalized speed for
that race using the particular level used for comparison. This works well, however,
only if the individual is being compared to a curve based on runners of about
the same ability. Getting a typical high-schooler's speeds as a percentage of
world records, for instance, can be misleading. A 'good' high school sprinter,
for example, may run 100m only 10% slower than the world record, while an 'equally
good' high school miler might be nearly 20% off world records. To compensate
for this effect, I developed a quantity I call 'performance factor' (not surprisingly,
I found recently that this term has been used before for a similar type of rating).
This quantity equals a percentage of world records at the mile, but is skewed
to yield lower values at shorter distances and higher at longer ones so that,
for example, the top high school sprinter in a state should get about the same
rating for 100 m as the top cross country runner gets for 5K. In this way, performance
factor measures essentially the same thing as do Purdy points, and the runner's
best event is approximately the one that yields his/her highest p.f.
As for curves based on only one point, there is some merit as well, since a
runner may have been running only one event in recent weeks. For this reason,
the program does allow single entries, but to make the curve more realistic,
age and training data (in the simplified form of total miles per week, which
ideally assumes some appropriate-to-the-event balance ofspeed versus endurance
work). Generally, higher mileages are assumed to be associated with greater
endurance versus speed and aging is assumed to have a similar effect, though
small since both endurance and speed show declines past about 30 years. With
this information, the single point curve can be nearly as good as the two point
one, or even better if one of the two points was a significantly sub-par performance.
Some small sex difference is included as well, though male and female runners
of similar ability have fairly similar performance curves.
Perhaps the program's most advanced capability is that it can sort through up
to five different performances, weed out the bad ones, and try every possible
combination of two points to yield the best one (though on very rare occasions
with unusual data a point could get missed). It also can find the likely best
performance of all and take into consideration the curve suggested by the remainder
of points as well as the training and age data to generate a really accurate
curve. Both options can be tried alternately on the same data set. If the races
span a large range of distance and were allreally good efforts, the 'best two'
method may be better; with narrowly spaced results and/or widely varied race
conditions or efforts the 'use all data' method is probably better.
Three other outputs generated are the 'fully aerobic training pace', which is
actually used by the program, the 'aerobic threshold pace', and the 'VO2max
pace'. The first closely represents an appropriate pace for longer training
runs or 'easy' days, with heart rate about 70% of maximum, especially for fairly
typical distance runners, though sprinters' (who don't often run far anyway)
data may yield 'aerobic paces' that may be too slow. The second refers to the
pace at which lactic acid begins to build much more rapidly and is appropriate
on certain types of 'hard' days. The VO2max pace produces maximum oxgenuptake,
though one can sprint faster. This pace is appropriate forinterval training
with the goal of increasing this ability to take in oxygen; faster interval training
yields little additional benefit in this area and can be too stressful for optimal
training.
In summary, I believe many aspects of this program's approach to be truly unique
and remarkably accurate over a very wide range of abilities and distance specialties.
A number of other options are available in the registered version.
Additional features of the registered version
Most of the features of the registered version are available to at least some
extent in the shareware version. Here are some of the additional features you get with
registration:
- Printouts and saved text files of the full report (predictions for 30 different
distance races, plus training and specialization analysis).
- Printouts of various other forms and tables
- The ability to save personal race data for later retrieval
- The ability to specify different race distances and hill slopes on the special
data output form
- The ability to change parameters on the Performance Tables form
- The ability to change units or data ranges for hill and treadmill forms
- Program boot-up with data from the last time you ran the program
When you register, you will receive a unique compilation of the registered
version, with your name visible at boot-up. For this reason, you may want to
specify the first and last name of the runner who will most often use the program.
You can change the name at run-time, however.
Runpaces 7.1 corrected two minor bugs that were found in Runpaces 7.0, which
was the first update to the program nearly four years. The algorithms for the
effect of inclines (hills or on a treadmill) have been improved ni light of
extensive new data, and the heart rate versus speed algorithms and output have
been improved and expanded. The basic performance prediction algorithm remains
the same as before, as continued use has confirmed its high accuracy. Version
6.0 included some modifications were made at the longer distances for highly
trained runners, in light of further data analysis, and estimated heart rates,
as well as improved estimates of aerobic and lactate threshold paces were added.
Air resistance effects added consideration of a runnerr's height and weight.
One example is a feature estimating the effect of wind on running performance.
A wide variety of scenarios are modeled: head wind, tail wind, out-and-back
head then tail winds, cross winds, circular paths, and oval tracks with winds
perpendicular or parallel to the straightaways. Previously, Version 5.0 added
acouple of items, including tables of power output and caloric expenditure,
and treadmill equivalent paces at different slopes.
Limitations
Obviously, human beings are not as predictable as, say, solar eclipses, so no
model will be accurate for everyone all of the time. Not only does one's physical
state vary widely from day to day, but the crucial mental component may be quite
fickle as well. The type of runner that this program really models well is the
diligent, mentally strong type who trains intelligently and can perform up to
potential at will. There actually are a lot of runners like this, even in high
school. Self trained runners often have the self discipline to perform consistently
as well.
Course conditions and weather can have major and obvious effects as well. The
program may have trouble predicting cross country times, as it really requires
the consistency of a track or flat course for best results. Heat, while a rather
minor factor in races lasting only a few minutes, really takes a toll in longer
events. Basically the program can only be as accurate as the runner and conditions
are consistent.
One potential problem to avoid is the confusion (to the program!) caused by
using results collected over a span of many years, or even weeks if one's condition
is changing rapidly. Using a mile time run in high school with a 10K run at
age 40 may not be very meaningful, and for a runner peaking for an important
race, a result from three weeks previous may give a misleading (often pessimistic)
prediction. As for training data, the 'miles per week' is perhaps best thought
of as an average over the last two months or so. All this is really fairly obvious,
but mentioning it here should serve as a reminder to consider these issues in
choosing data to feed the program. Afterall, 'garbage in, garbage out'.
Likewise, there is a situation in which some of your input races will not be
fully included in the analysis. This occurs when some of the longer races entered
were actually run at a faster pace than some of the shorter ones. This is the
result of a procedure which deliberately 'weeds out' races that could not possibly
be the runner's best,which of course is appropriate. The problem is that, if
this occurs several times in the input data, there may be only one race left!
In such cases the output is questionable - but then, so was the input. The solution
is to always use the best few races, avoiding 'junk' data that should not be
considered in the analysis.
Of course the only way to see what I'm talking about firsthand is to try out
the free demo! In case you don't want to scroll all the way back up, it can
be downloaded here.
References
Daniels, Jack PhD., Daniels' Running Formula, Second Edition: Human kinetics,
Champaign, Illinois, 2005.
Martin, David E. and Coe, Peter N., Training Distance Runners. Champaign, Illinois,
Leisure Press, 1991.
Gardner, James B. and Purdy, J. Gerry, Computerized Running Training Programs.
Los Altos, California, Tafnews Press, 1970.
Costill, David L., A Scientific Approach to Distance Running. Los Altos, California,
Track & Field News, 1979.
Jarver, Jess (Ed.), Long Distances: Contemporary Theory, Technique, and Training.
Mountain View, California, Tafnews Press, 1995.
World Association of Veteran Athletes (WAVA), Age-Graded Tables. Van Nuys,
California, National Masters News, 1994.
Maffetone, Philip, The Big Book of Endurance Training and Racing. New York,
New York, Skyhorse Publishing, 2010.
See Also: Large Scale Pace Study
Web Page
Related links you might want to check out include Patrick
Hoffman's Cross Country and Running Analysis page, which discusses several
different performance models including Purdy points and modifications thereof.
If you want to try an online pace prediction, there's the Team
Oregon Pace Wizard. This one is somewhat similar to Runpaces, but uses only
one race on which to base your performance curve. You can actually enter three
races, but it simply picks the one it thinks is best and apparently (from my
experiments on it anyway) ignores the others. I believe it to be accurate only
for long distance (i.e. over 10K) specialists and actually the page acknowledges
something to that effect. One neat thing about it is that it gives heart rate
estimates, too. Runner's World also has a pace
predictor on its web page, but this one, which uses a 1.06 power law, is
also geared toward high-mileage, long distance specialists and I believe the
power law fit to be less accurate than either the Team Oregon model, or Runpaces,
which I honestly feel is the best I've seen.
(c) Copyright Thomas J. Ehrensperger 2015
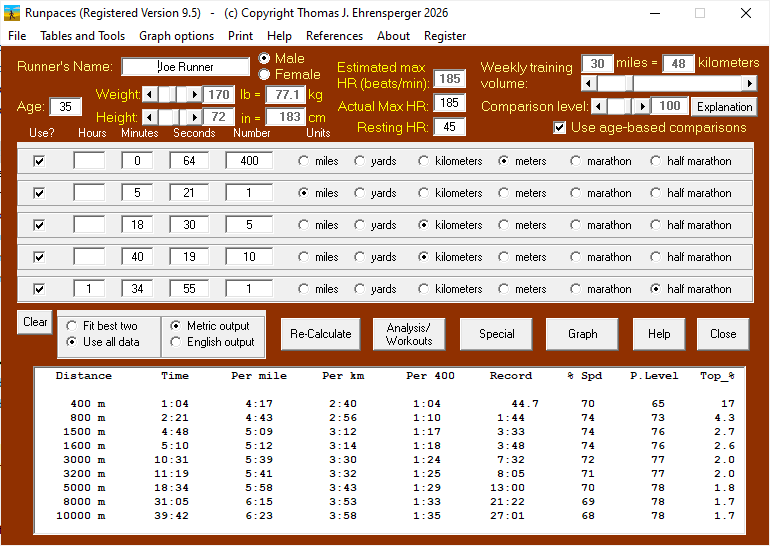 This is the main form, just after entering data and clicking the Calculate button
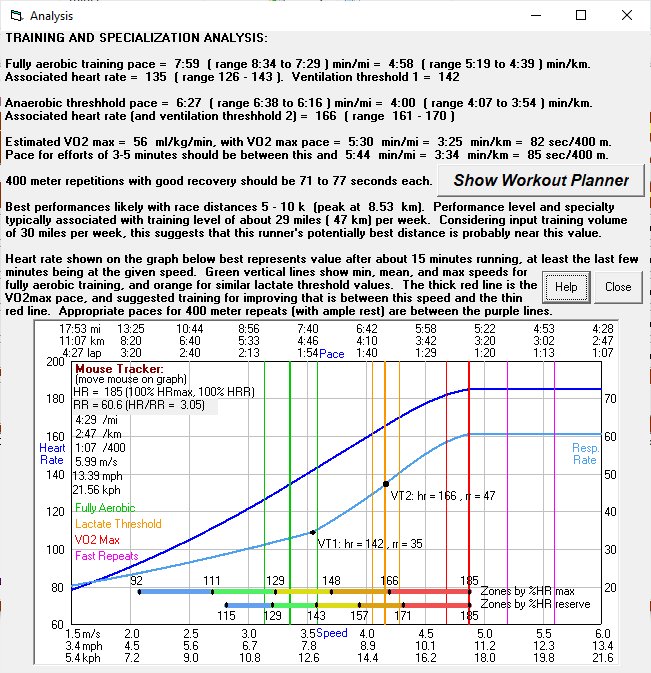 Clicking on Analyze brings up this information
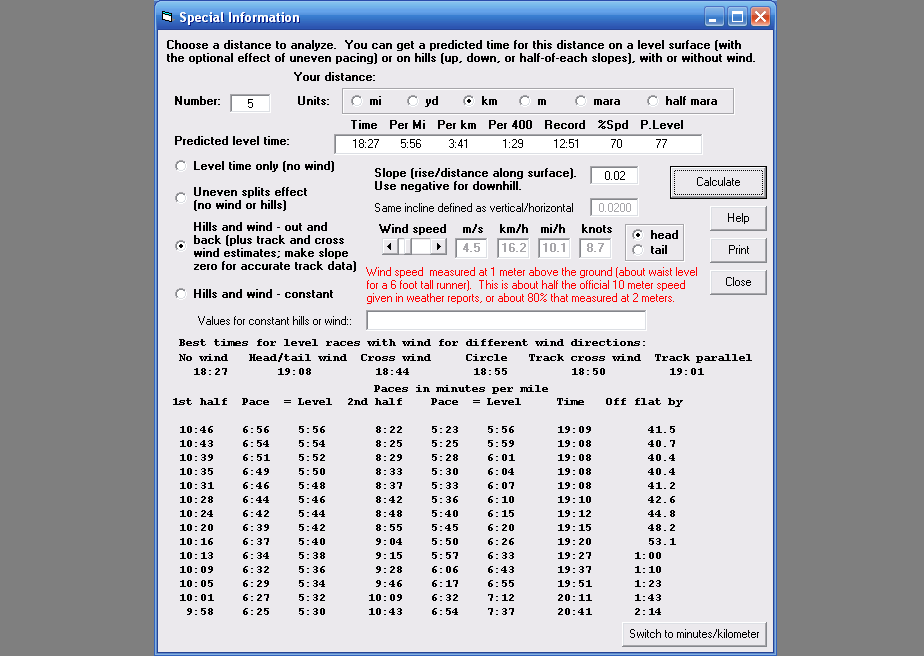 Here's a sample of information obtained by clicking Special. This
particular option shows the effects of different pacing strategies on a course
with a grade of 5% uphill on half the course and 5% downhill on the other half,
compared to the race time for a flat course.
Here's a sample of information obtained by clicking Special. This
particular option shows the effects of different pacing strategies on a course
with a grade of 5% uphill on half the course and 5% downhill on the other half,
compared to the race time for a flat course.
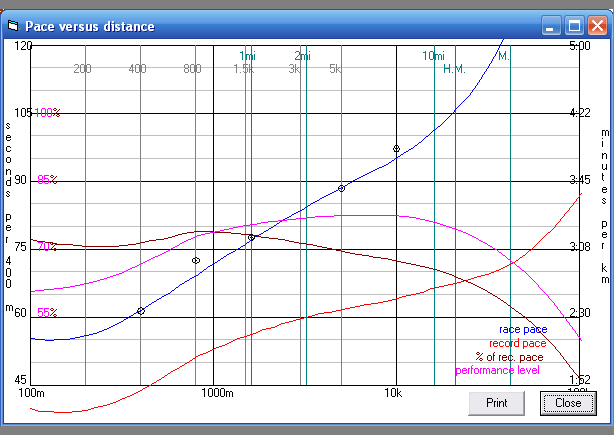 Clicking Graph yields a plot of the generated performance curve
and the points used to create it. It also shows world records, percent of record
pace, and the performance level, indicating that this runner's best performances
relative to others at distances somewhere around 5 kilometers
Clicking Graph yields a plot of the generated performance curve
and the points used to create it. It also shows world records, percent of record
pace, and the performance level, indicating that this runner's best performances
relative to others at distances somewhere around 5 kilometers
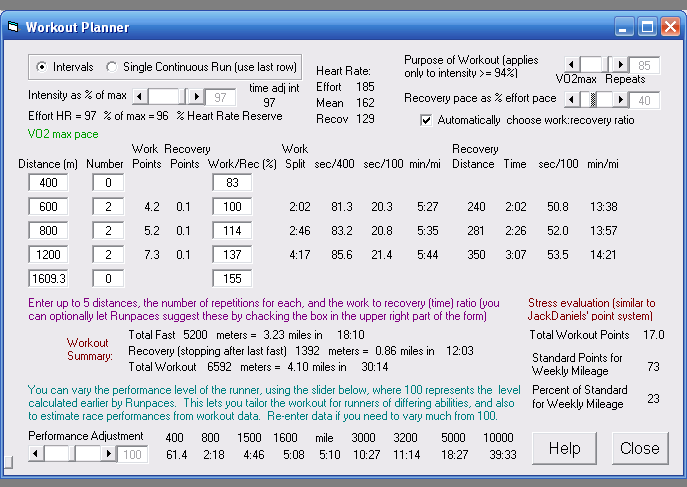 The Workout Planner calculates effort and recovery paces for various types
of workouts, specific to your own performance level and relative strengths. This can
also be used to predict race performances from workout data.
The Workout Planner calculates effort and recovery paces for various types
of workouts, specific to your own performance level and relative strengths. This can
also be used to predict race performances from workout data.
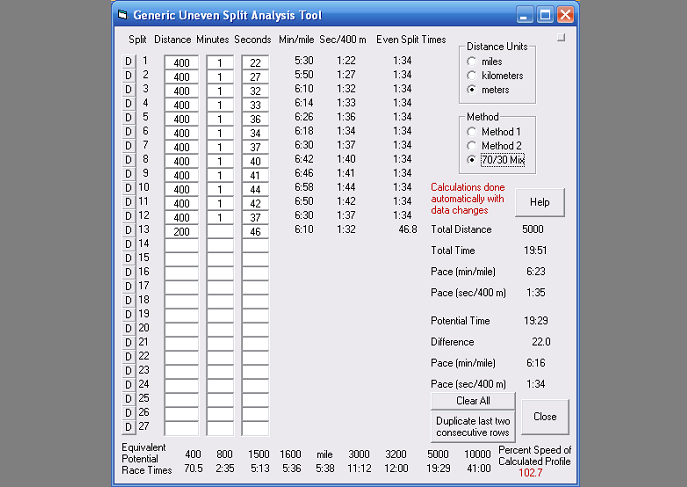 The Generic Uneven Splits Analysis T ool lets you see what you could have run
with even splits, for the entered race (or workout) and many other distances.
The Generic Uneven Splits Analysis T ool lets you see what you could have run
with even splits, for the entered race (or workout) and many other distances.
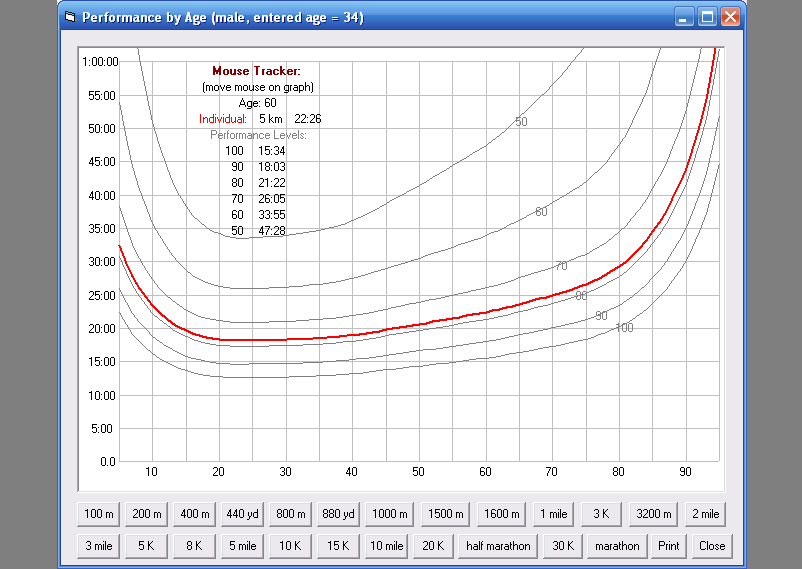 This table shows estimates of this same runner's performance at
different ages, assuming fairly consistent training effort
This table shows estimates of this same runner's performance at
different ages, assuming fairly consistent training effort
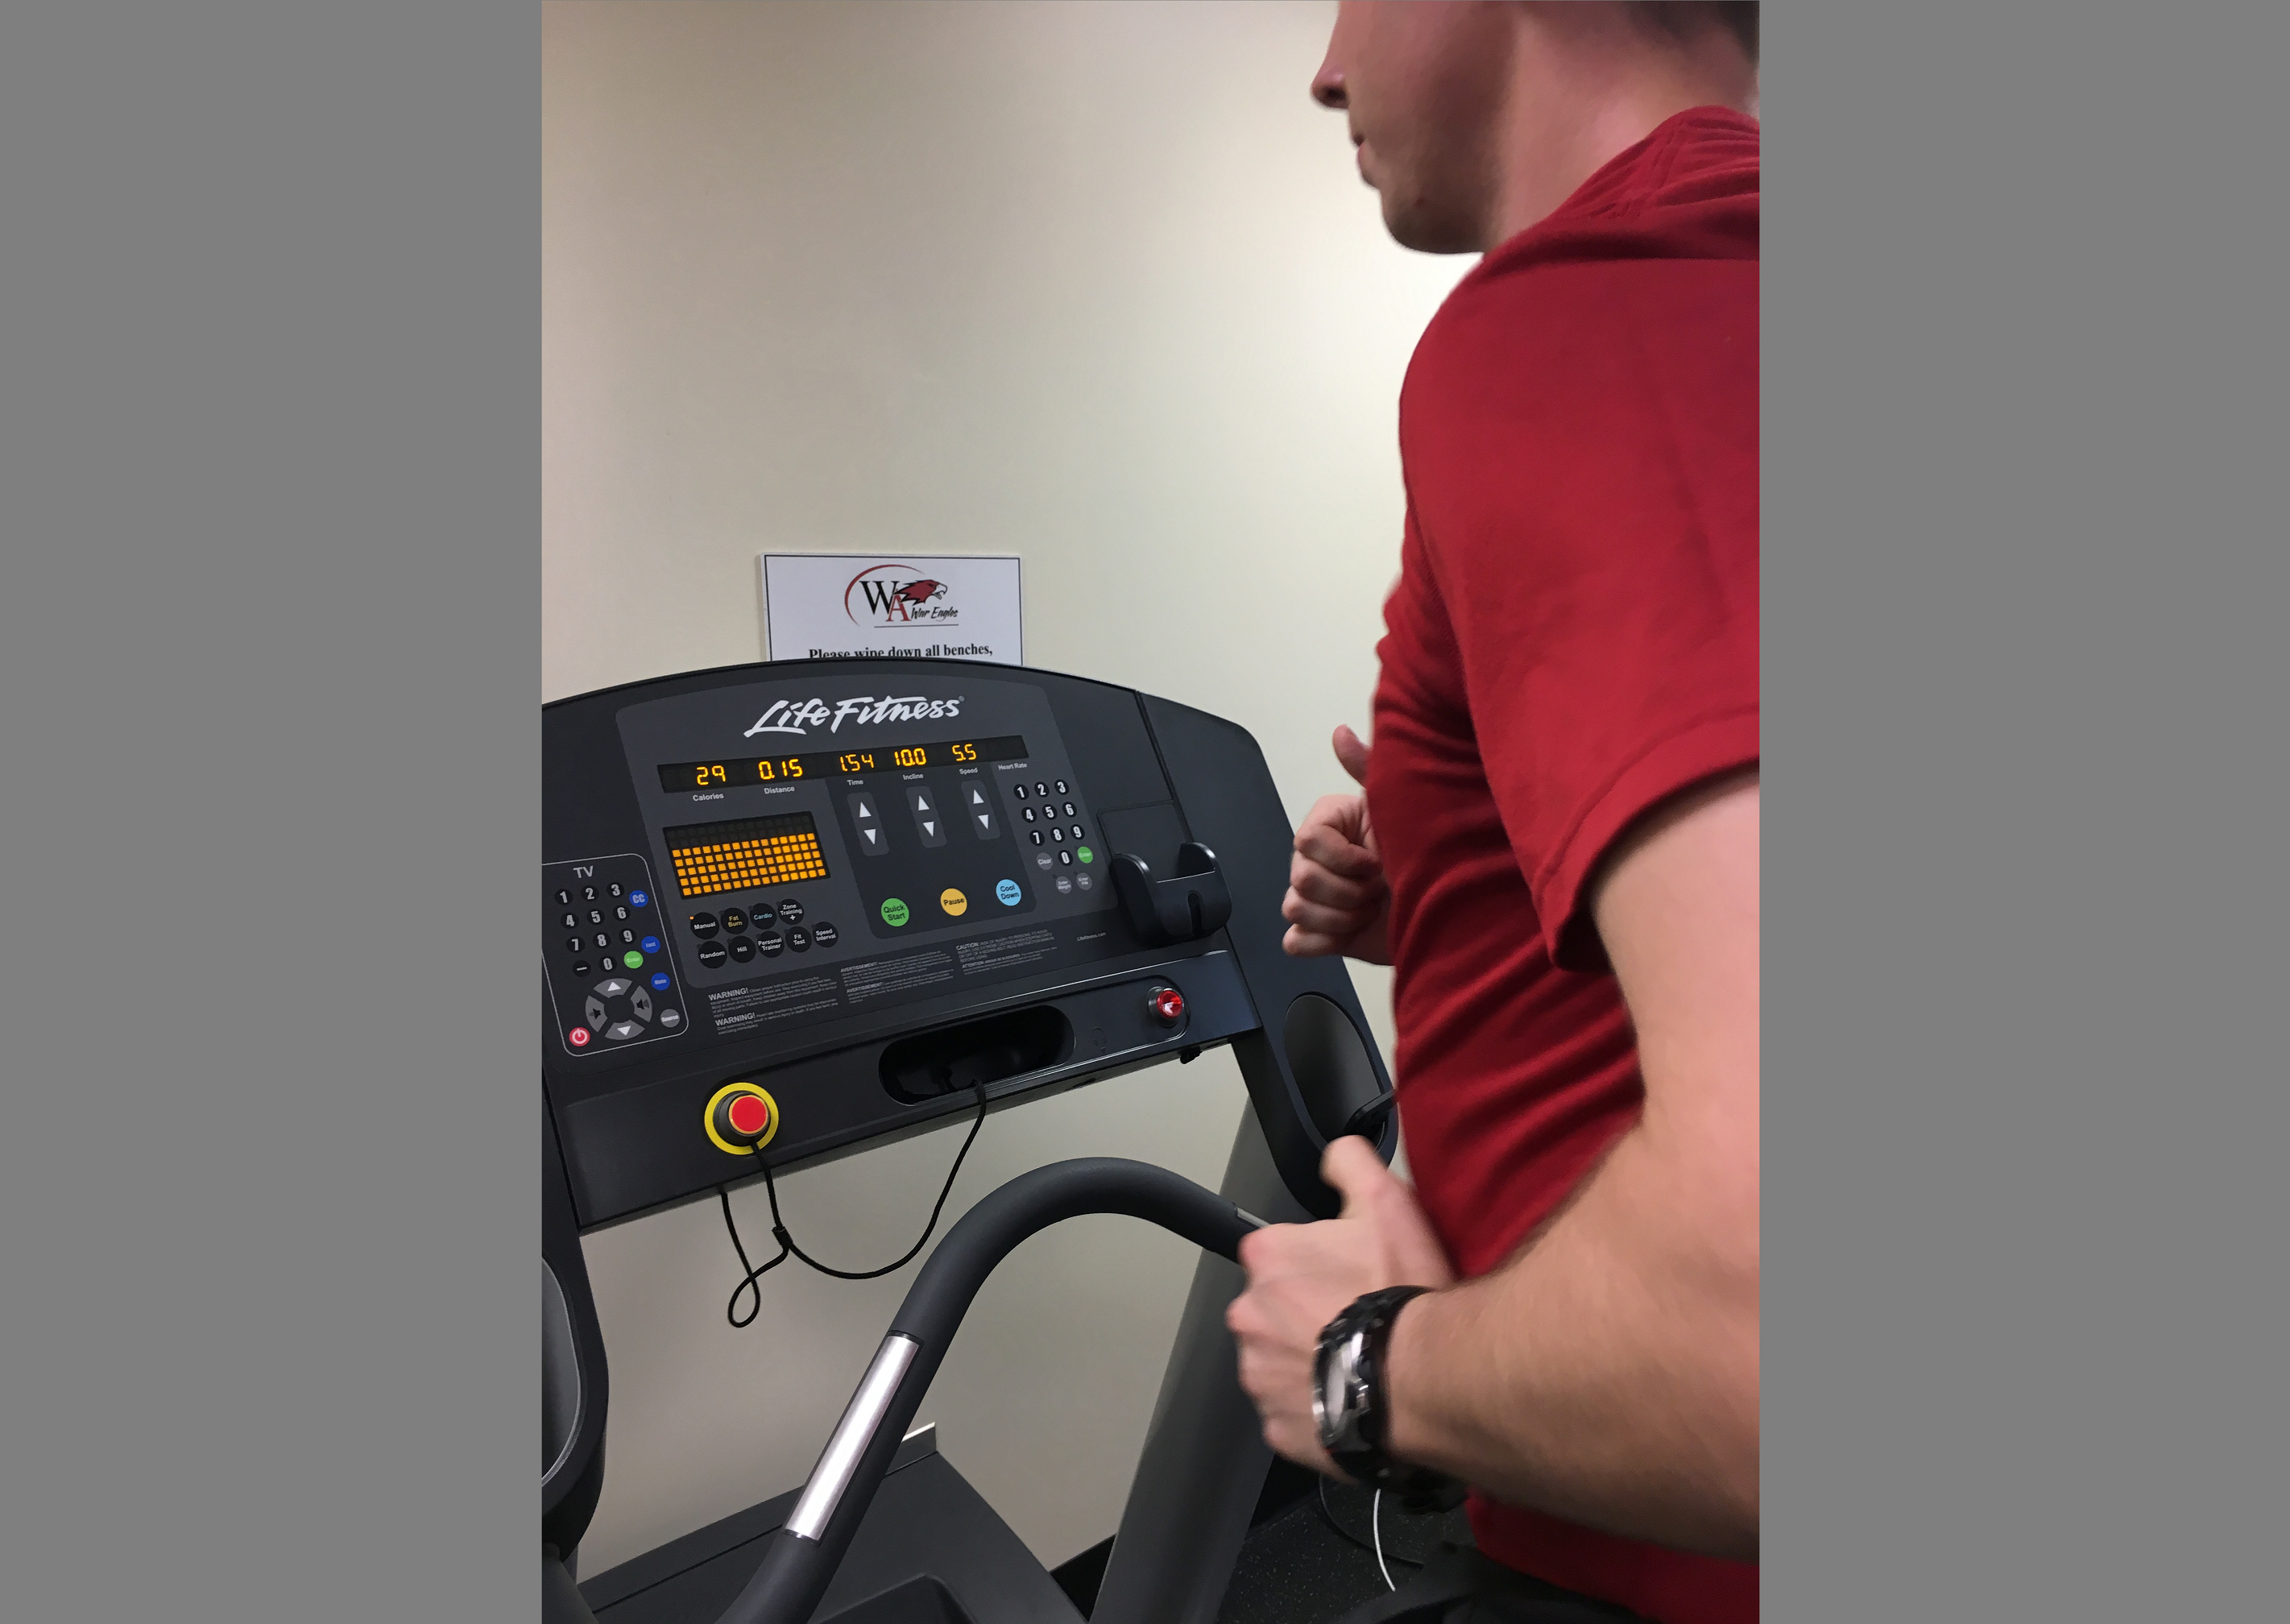 Runpaces calculates that 5.5 mph on a 10% incline is equivalent to 8.36 mph (7:11/mile) level outdoors, and that this 200 lb runner is burning 1278 Cal/hour with a power output of 293 Watts.
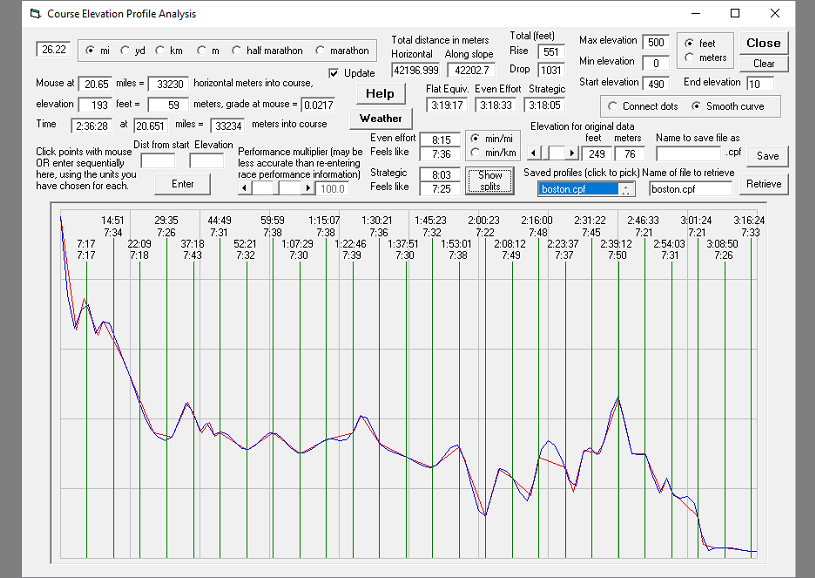 This tool allows you to enter course elevation profile data and calculate a wealth of information about pacing, splits, and the effect on overall race time. It even models elevation's effect on oxygen availablity.
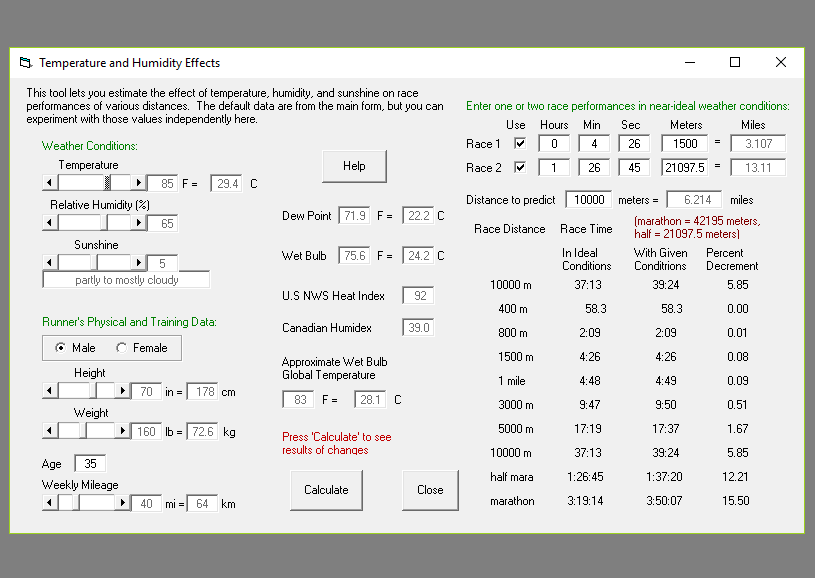 Temperature, humidity, and sunshine have a significant effect on performance, but this varies with many factors, including body morphology and duration of the race. Runpaces carefully takes all this into account.